Bison

Industry intelligence that matters

Category: Venture Capital

Digging In To Distributions: An Update on Venture Capital’s Issue

by Michael Roth

Last summer, I highlighted the glaring lack of distributions within the VC industry since the late 1990s. It’s been over six months since I published that piece so I wanted to provide an update on where things stand through June 30, 2015.

VC Funds Have Cashed Out Where They Could

Q2 2015 VC DPI and TVPI

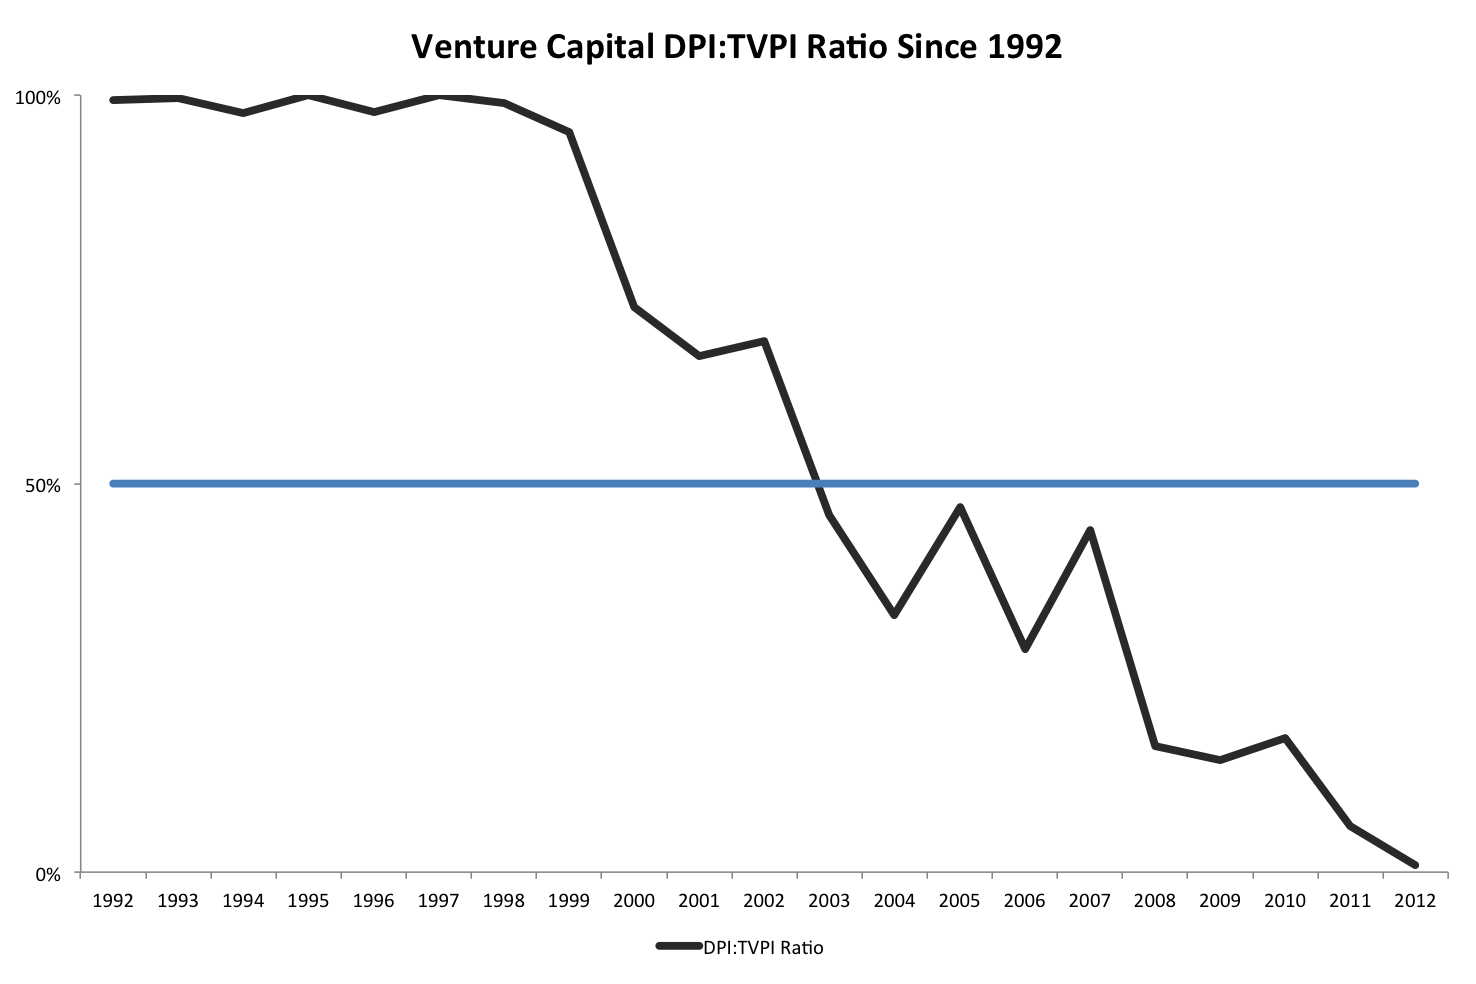
Venture capital funds saw a strong distribution pace during the first half of 2015. Looking at the DPI:TVPI ratios, the 2003 – 2007 vintage years saw a noticeable increase – improving by 32% on average. Three of those vintage years jumped above 0.5 barrier which means the average fund has distributed more than half of its total value. As a reminder, the DPI:TVPI ratio is a measure of how much of a fund has been realized (a ratio of 1 means the fund is fully realized).

DPI Multiples Improved but Still Below 1.0x

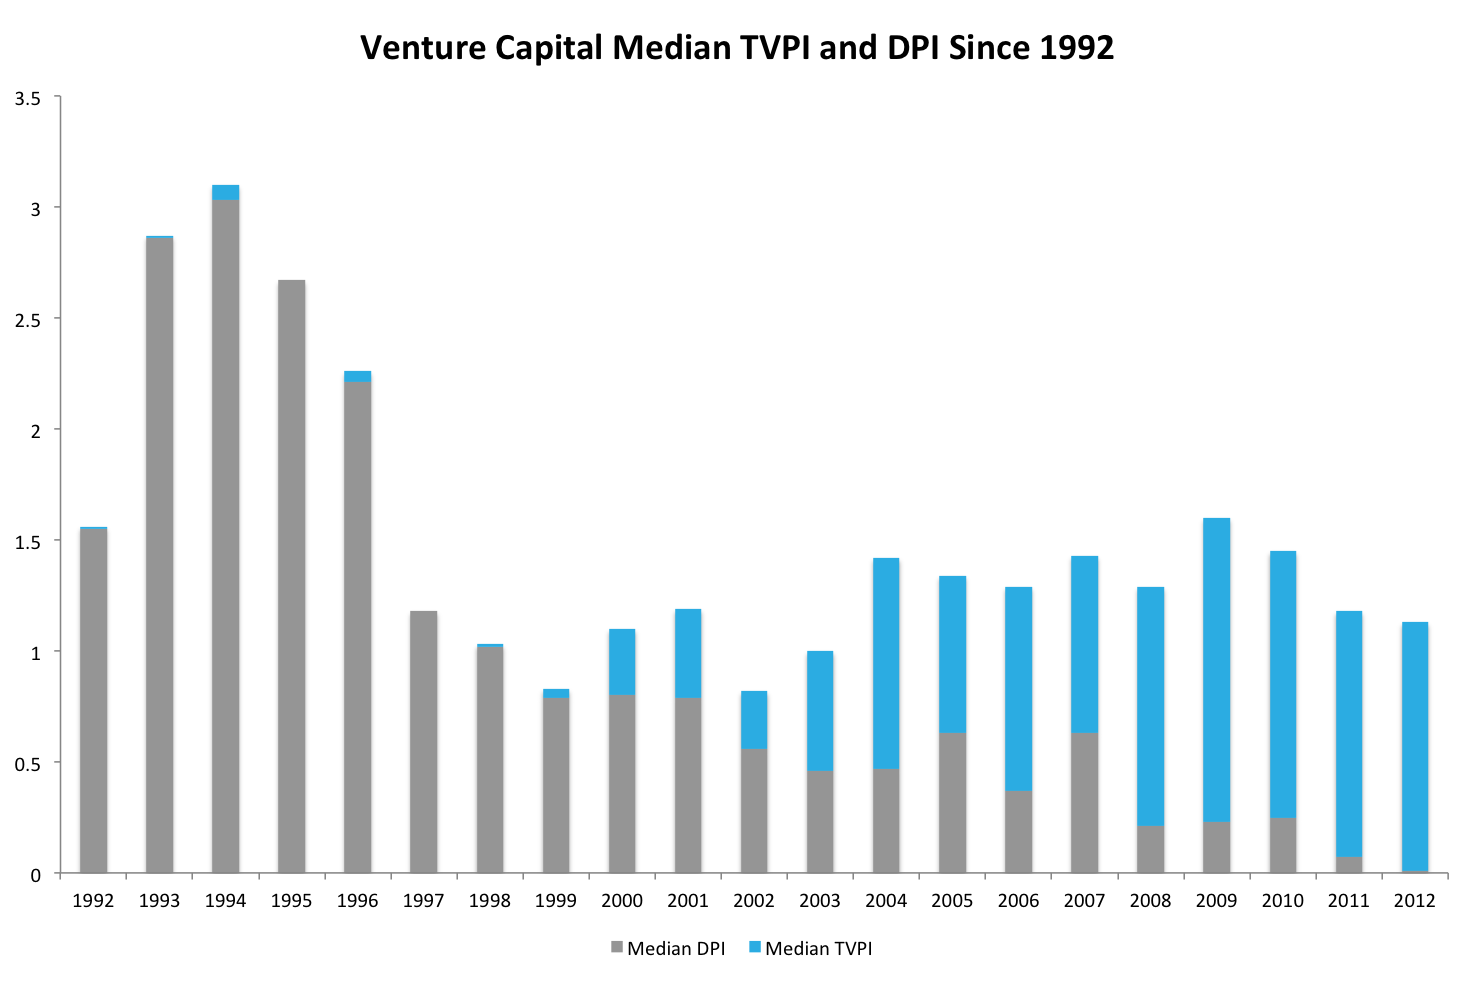
DPI multiples are still struggling to reach 1.0x, which means the average fund since 1998 has yet to return 100% of what investors have paid in.

VC DPI Since 98
The two years that stick out are 2003 and 2010. These are the vintage years that saw the biggest increase in median DPI. 2003 sticks out because it is on the cusp of a 1.0x DPI multiple but 2010 actually saw a bigger increase, percentage-wise. Funds that drove the increase in 2010 include Union Square Ventures Opportunity Fund and Insight Venture Partners VII on the tech side and Third Rock Ventures II, Orbimed Private Investments IV, and MPM Bioventures V on the healthcare side. 

VC DPIs Lagging But TVPIs Not As Far Behind

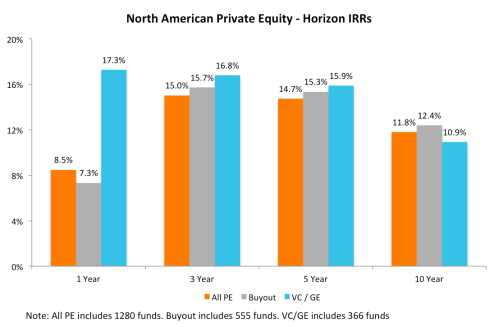
My analysis of VC distributions so far has highlighted the positive developments. What can’t be ignored is that these positive developments have not occurred in a vacuum. The buyout industry’s DPI multiples also improved and are still higher than the venture capital industry for 13 of the 15 vintage years from 1998 through 2012.

Buyout vs. Venture

While the DPI multiples have clearly been lagging, venture capital’s median TVPI multiples have shown strength over recent vintage years. The big question is whether these TVPI multiples are real or is it a matter of time before they come back to reality. 

Final Thoughts

Venture Capital had a solid two quarters to start off 2015 but the DPI issue still remains. Since the industry is prone to large valuation fluctuations, the ability to cash out when times are good is an important part of being successful. This analysis is also important because investors need to analyze and decide whether an allocation to venture capital is worth the risk.

While DPI multiples have increased across nearly every vintage year, the DPI:TVPI ratio is still lower than that of the buyout industry for all but one vintage year since 2000. This means LPs remain highly exposed if this current cooling off phase accelerates into a bigger decline.

Venture Capital Continues its Hot Streak

by Michael Roth

Bison’s June 30, 2015 final benchmarks were published last week. Using our cash flow dataset (“Bison funds”), we are able to analyze close to 1,300 North American private equity funds and identify industry trends.

Horizon IRR

The chart below illustrates the 1, 3, 5, and 10-year horizon IRRs for North American All PE, Buyouts, and Venture Capital / Growth Equity.

Q2 2015 Horizon IRRs

For the second consecutive quarter, the venture capital industry has a higher IRR over the 1, 3, and 5-year periods than the buyout industry. VC is still lagging buyouts on the 10-year horizon but it has narrowed the gap by 100 basis points over the last two quarters.

Time-Weighted Returns

The chart below looks at the returns for private equity and the public markets using an apples-to-apples time-weighted methodology.

Q2 2015 TWRR

Over the short-term and long-term, private equity is outperforming the public markets, represented here by the Russell 2000 and Russell 3000 total return indices. Similar to the horizon IRRs, venture capital is outperforming buyouts over the 1, 3, and 5-year periods. Over the 10-year period, buyouts are still outperforming venture capital by more than 200 basis points. Looking at the medium-term (3 and 5-year horizons), the public markets are outperforming through June 30, 2015. It will be interesting to see how these numbers hold up as of Q3 and Q4 2015.

Investment Activity

Investors are surely happy with the strong returns but they must also be pleased that GPs were busy selling assets and locking in gains. The chart below illustrates the ratio of distributions to contributions during each of the last four quarters. A ratio greater than 1.0 means there were more distributions than contributions in the quarter.

Dist vs. Calls

Both the venture capital and buyout industries saw their Distributions/ Contributions ratios jump in Q2 2015. Given how tumultuous the public markets were during the second half of 2015, it will be interesting to see how this ratio changes in Q3 and Q4. The surge in distributions is also notable for the VC industry because the inability to return money to investors has been an issue that I have highlighted before.


Understanding Private Equity Cash Flows

by Michael Roth

From our experience working with 100s of participants on both sides of the market, there are lingering uncertainties and varying interpretations about how best to prepare and analyze cash flows. Our goal is to help GPs and LPs build and present cash flows in a consistent manner.

In the discussion below and subsequent pieces, I will detail how we at Bison think about cash flows and what we believe should be the industry standard. Our thinking closely aligns with the CFA Institute’s Global Investment Performance Standards (“GIPS”) and their Guidance Statement of Private Equity.

Read the rest of this entry »

A PME Analysis of Private Equity

by Michael Roth

Before we move on to 2015, let’s take one final look at where private equity stands as of Q4 2014. Using our cash flow data, I compared the pooled net IRR for the 2000 through 2012 vintage years to the Bison PME for the Russell 2000®. I focused on North American and Global funds, where the Russell 2000 could be a relevant public market comp. Funds in this analysis account for close to $1 trillion of committed capital.

Buyout Funds vs. Russell 2000

North American and Global buyout funds have outperformed the public markets in nine out of the thirteen years analyzed.

12.31.2014 Buyout PME

Buyout funds enjoyed strong outperformance of the public markets from 2000 through 2005. Since then, buyout fund performance has been mixed with four of the last seven vintage years underperforming the markets. The reason for this is two-fold. Everyone knows how funds from these vintages, primarily 2006 – 2008, did some bad deals (think TXU) and have had to lengthen their holding periods to try and recoup their cost (think Freescale). A higher number of bad deals and longer holding periods have clearly hampered returns for these vintages.

What also can not be ignored is the incredible bull market in public equities over the last six years. The Russell 2000 has tripled since it bottomed out in 2009. This is not meant as an excuse for the private equity industry but an acknowledgement of the public market’s incredible, and probably unrepeatable, returns over the last six years.

More recent vintages seem to be showing favorable signs. However, it can be hard to draw definitive conclusions from PME analysis when funds are only nearing the end of their investment period and have not yet had time to mature.

Venture Capital & Growth Equity vs. Russell 2000

North American and Global VC/GE funds have outperformed the public markets in just six of the thirteen vintage years analyzed. However, four of the six years have occurred since 2007 – highlighting the VC/GE market’s recent strength.

12.31.2014 VC PME

The venture industry has also suffered due to the strong public markets while underperformance in the early 2000s can be attributed to the dot-com crash. Compared to the buyout industry, VC/GE performance against the public markets has been mixed, though there are encouraging signs in the more recent vintages.

Wrapping Up

Compared to each other, the buyout industry has bested the VC/GE industry in eight of the thirteen years. However, VC/GE have outperformed buyouts in four of the last six year through 2012. Whether or not VC/GE can sustain this recent strength will likely depend on their ability to exit these high momentum companies which have seen tremendous valuation increases over the last few years.

Here’s Why the Venture Capital Crash Will Hurt

by Michael Roth

The primary issue with the current valuation bubble is the industry’s inability to distribute returns to investors. LPs have continued to show faith in the venture capital industry, but their leniency may be what ends up hurting them whenever the bubble pops.

Half of the Industry’s Total Value Created Since 2003 Is Just “Paper Profits”

A good way to visualize the industry’s problem is too look at the ratio of DPI (distributed capital to paid in capital) to TVPI (total value to paid in capital). During a fund’s early years, you expect to see a large difference between between DPI and TVPI (ratio closer to 0%). As a fund gets closer to the end of its 10 year life, you expect the DPI and TVPI to converge. In the chart below, that is illustrated by the DPI:TVPI Ratio line approaching 100% as you move right to left.

VC DPI TVPI Ratio


Looking at the ratio can tell you one of two things:

  1. A lower ratio could be indicative of a portfolio that has good upside potential remaining.
  2. A lower ratio could be indicative of a portfolio that is having issues exiting portfolio companies and realizing returns.

The way to identify where a fund stands would be to compare it to its peers, but also to look at the age of the fund. As I mentioned, a fund approaching 10 years old should have a DPI:TVPI ratio that is approaching 100%.

Since 2003, the median DPI:TVPI ratio for the venture capital industry has been below 50%. This means that half of the total value created by the VC funds since 2003 is only on paper. Similarly, a large portion of the recent valuation increase for VC funds is only on paper and that is where it may stay unless VC firms begin to distribute returns.

Half of the Funds Raised Since 1998 Have Distributed Less Than Investors Paid In

Another concern for the VC industry is the proportionate size of distributions. Specifically, looking at VC returns on an absolute basis, the industry has not had a strong DPI ratio since 1996, when distributions significantly exceeded paid in capital.

VC DPI TVPI Benchmark

Worse yet, the median DPI ratio has not been greater than 1.0x since the 1998 vintage year. This means at least half of the funds raised since 1998 have yet to distribute a return in excess of paid in capital to investors since 1998. To give you a sense of how big of an issue this is, venture capital firms have raised $480 billion since 1999, according to NVCA figures.

By comparison, you only need to go back to 2003 to find a median DPI figure above 1.0x for the North American buyout industry.

What Does This Mean for the Current Euphoria?

VC Fundraising

The ability of managers to realize returns should be a real concern for investors in light of the recent rise in valuations. But looking at recent fundraising data, investors are buying into the hype.  In 2014, venture capital firms raised more than $30 billion, which is well above the average amount raised since 2001. Investors seem to be putting a lot of faith in VC managers, their ability to value portfolio companies, and their ability to realize returns.

The amount of leeway given to venture firms is confounding since buyout firms are often advised by LPs to make some distributions from their existing portfolio before they consider going out fundraising again. LPs often say “show me some exits” before they feel comfortable recommitting to the next fund. With an average DPI:TVPI ratio of 16.5% for the 2007 – 2012 vintage years, venture capital firms may be avoiding this pressure for the most part. The average DPI: TVPI ratio for buyout funds of the same vintages is 22.5% (37% higher).

Wrapping Up

The VC industry’s inability to distribute returns to investors is a glaring deficiency that is leaving investors exposed to likelihood that valuations will come back down to earth. Unless there is a dramatic wave of distributions, the recent valuation bubble will be yet another painful lesson for LPs who seem to keep forgetting the industry’s inability to distribute returns.

Don’t worry about the VCs though. They will still be earning a 2% fee on the record amount of capital they have recently raised.

Unicorns And The Next Venture Capital Crash

by Michael Roth

You can tell the VC industry is hot because there have been a plethora of articles and blog posts discussing the industry. In two parts, I will highlight the impact unicorns have had on the venture capital industry. They have undoubtedly rejuvenated the industry but evidence of excess is becoming more apparent.

To get a sense of where we are now, consider these stories:

  • The 10 largest unicorns have raised $15.6 billion from 137 investors, according to Crunchbase.
  • 71% of companies that went public in 2014 had no earnings.
  • 16 venture-backed companies have raised capital at a $1 billion valuation so far in 2015.
  • Firstmark raised $200 million for Pinterest’s latest round of financing ($11 billion valuation) from seven investors in three days.

And everyone knows Uber. The company is a juggernaut but its ascendance highlights several of venture capital’s issues, including aggressive growth assumptions and return expectations and the prevalence of “me too” companies.

One concern is how later stage investors are valuing the unicorns and what it means for return expectations.

Uber is reportedly valued at $41 billion and has raised $5.9 billion from 43 investors since 2011.

Based on rumors, Uber’s revenue growth has been explosive. It is believed they achieved $667 million in revenues in 2014 and they are projected to achieve $2 billion in revenues in 2015. That would be two successive years of 300% growth. Assuming a 25% EBITDA margin, that would give Uber an EV/EBITDA multiple of 82x based on 2015 projected EBITDA.

For those who invested in the early rounds, Uber has been and will be a great investment. For the later stage investors, like Foundation Capital, NEA and Qatar Investment Authority, how many more years of explosive growth are needed to generate an acceptable return for investors?

Another question some may ask is: How does this compare to public market valuations? Within the transportation industry, Uber’s valuation puts it in the same league as FedEx, which has an enterprise value of $52 billion.

FedEx has:

  • $47 billion in revenues  for the twelve months ended in February 2015.
    • 4.4% y-o-y
    • 3.8% over the last three years
  • $6.75 billion in EBITDA for the twelve months ended in February 2015.
    • 27% growth y-o-y
    • 8.6% over the last three years
  • EV/revenue multiple is 1.1x; EV/EBITDA multiple is 7.7x.
  • Intergrated Shipping & Logistics Industry Averages:
    • EV/EBITDA multiple – 10.6x.
    • EBITDA margin – 9.1%

Clearly, FedEx is a mature company whose growth rates do not come close to Uber’s. Still, the comparison puts a spotlight on how aggressively investors are currently pricing growth. Uber’s revenue and EBITDA are a fraction of FedEx’s but they are closing in on them from an enterprise value standpoint.

Another major concern is how will the unicorns generate liquidity.

This issue is closely tied to the previous concern regarding valuation. At a valuation of more than $1 billion, the unicorns are no longer little tuck-in acquisitions for corporate acquirers. This leaves the public markets as the likely exit route for many of the unicorns. However, late stage venture investors have been aggressively pricing the later rounds so that leaves less upside for public market investors.

If one too many of the unicorns disappoint in the public markets, investor sentiment can quickly turn negative and slam the IPO window shut for the rest of the unicorns.

The abundance of “me too” companies and their ability to receive funding is another symptom of market excess.

Have you heard of GetTaxi or Flywheel? They are mobile taxi apps that have raised $200 million and $35 million, respectively, since 2009.

Eager to have a portfolio company “in the space”, VCs provide more capital than is necessary to more companies than are feasible for an industry. Once the market becomes saturated, the end game for many companies turns into “let’s carve out a niche so one of the market leaders can acquire us” as opposed to “let’s provide innovation in a way that transforms an industry”.

The fierce competition in the mobile taxi app space is a prime example of this. The “Deal of the Day” space (Groupon, LivingSocial, etc.) is another good example as they experienced their boom and bust a few years ago.

Finally, one of the tell-tale signs of an inflated market is that investment discipline becomes less disciplined.

On more than one occasion, industry leaders, like Bill Gurley and Fred Wilson, have questioned the sustainability of the record high burn rates the industry is currently seeing. The answer to this seems to be, give them more capital!

According to the NVCA and PwC MoneyTree, annual venture capital investment exceeded $48 billion in 2014 – the highest amount since 2000. During 2014, there were more than 40 “megadeals” (investments exceeding $100 million) and two deals of more than $1 billion.

To reiterate those points,

  • The amount of capital invested into the industry is at the highest it has been since the last VC crash, and
  • There were more “megadeals” in 2014 than ever before.

A Look Ahead

In Part 2, I will discuss unicorns’ impact on fundraising, show how they result in high fund valuations and highlight the potential issues from an LP’s perspective.