Bison

Industry intelligence that matters

Category: Private Equity Benchmark

Venture Capital Continues its Hot Streak

by Michael Roth

Bison’s June 30, 2015 final benchmarks were published last week. Using our cash flow dataset (“Bison funds”), we are able to analyze close to 1,300 North American private equity funds and identify industry trends.

Horizon IRR

The chart below illustrates the 1, 3, 5, and 10-year horizon IRRs for North American All PE, Buyouts, and Venture Capital / Growth Equity.

Q2 2015 Horizon IRRs

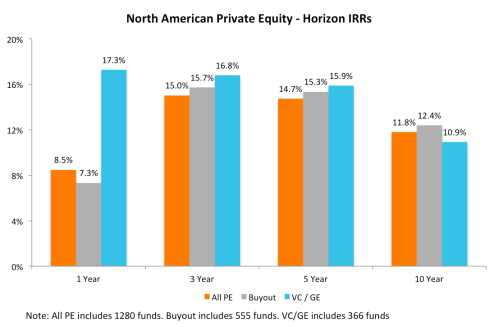
For the second consecutive quarter, the venture capital industry has a higher IRR over the 1, 3, and 5-year periods than the buyout industry. VC is still lagging buyouts on the 10-year horizon but it has narrowed the gap by 100 basis points over the last two quarters.

Time-Weighted Returns

The chart below looks at the returns for private equity and the public markets using an apples-to-apples time-weighted methodology.

Q2 2015 TWRR

Over the short-term and long-term, private equity is outperforming the public markets, represented here by the Russell 2000 and Russell 3000 total return indices. Similar to the horizon IRRs, venture capital is outperforming buyouts over the 1, 3, and 5-year periods. Over the 10-year period, buyouts are still outperforming venture capital by more than 200 basis points. Looking at the medium-term (3 and 5-year horizons), the public markets are outperforming through June 30, 2015. It will be interesting to see how these numbers hold up as of Q3 and Q4 2015.

Investment Activity

Investors are surely happy with the strong returns but they must also be pleased that GPs were busy selling assets and locking in gains. The chart below illustrates the ratio of distributions to contributions during each of the last four quarters. A ratio greater than 1.0 means there were more distributions than contributions in the quarter.

Dist vs. Calls

Both the venture capital and buyout industries saw their Distributions/ Contributions ratios jump in Q2 2015. Given how tumultuous the public markets were during the second half of 2015, it will be interesting to see how this ratio changes in Q3 and Q4. The surge in distributions is also notable for the VC industry because the inability to return money to investors has been an issue that I have highlighted before.


The Horizon IRR Metric Keeps Being Misused

by Michael Roth

Accurately measuring performance and estimating asset class returns is the most important part of the asset allocation process. The reason it is important is two-fold: (1) return estimates have the biggest impact on your asset allocation model and (2) studies have shown that asset allocation is a critical component of returns.

Considering this, industry trade groups, like the BVCA, and service providers, like Cambridge Associates, continue to inappropriately tout a horizon IRR calculation in comparison to the public market’s 1,3, 5, or 10 year time weighted rate of return.

As I have discussed previously, it is a mistake to think an IRR and a time weighted return are one and the same. Both are annualized rates of return but they deal with cash inflows and outflows in different ways. IRR specifically accounts for the timing and size of cash flows when calculating the returns generated while the time weighted return specifically excludes the impact of cash flows and weights the returns in each time period equally. Each method has their shortcomings and ideal use cases. Take these metrics out of context and they can be misleading.

What difference does a return calculation make?

I used a portfolio of 481 North America and Global buyout funds from Bison’s cash flow dataset to analyze the difference between the horizon IRR and the time weighted return. Both return calculations were performed using quarterly cash flows. Read the rest of this entry »

Why CalPERS Private Equity is Underperforming Their Benchmarks

by Michael Roth

We recently conducted an analysis of CalPERS’ private equity portfolio since 2000 using peer benchmarking analysis and PME analysis. As the largest private equity investor in the US, CalPERS is often viewed as an influential LP in the private equity community. While they are good at picking managers from its peer universe, PME analysis showed CalPERS to be insufficient at selecting managers that deliver alpha.

To be sure, private equity has been their best performing asset class in their portfolio over the long term but it has been underperforming CalPERS’ benchmarks over the 1, 3, 5, and 10-year horizons. Looking at investments made since 2000, CalPERS has committed 63% of their capital to above average managers. However, PME analysis showed that 57% of their capital is committed to funds that underperformed the Russell 2000.

Takeaways

  • Link between 1st quartile funds and PME outperformance – 75% of first quartile funds outperformed the market.
  • PME analysis shows peer analysis not comprehensive enough – 42% of funds that outperformed market were not in first quartile of peer universe.
  • Buyout funds performed best against the markets – 53% of their capital committed to buyout funds outperforming the market.
  • Fund of Fund performed the worst against the markets – 17% of the capital committed to fund of funds outperformed the market.

Conclusions

PME analysis has existed for close to 20 years but it’s use in fund analysis has really been perfunctory until recently. Most analysis is focused on peer universe analysis but PME analysis is increasingly being seen as a necessary and additive analysis that should be a part of the due diligence process. Bison believes this analysis could have aided CalPERS in their manager selection and investment style allocation.

Introducing Bison PME

by goksor

CHANGING HOW YOU THINK ABOUT PME BENCHMARKING

Today Bison is announcing the Bison PME methodology for estimating an IRR for a public market index. The new methodology addresses shortcomings of other public market equivalent (PME) IRR methods and how they handle cash flows. It is built on the work of Steven N. Kaplan and Antoinette Schoar presented in a 2005 paper titled Private Equity Performance: Returns, Persistence, and Capital Flows and introduces a way for estimating public market index cash flows for PME analysis. Investors can use the Bison PME alongside Kaplan Schoar PME to evaluate the speed and size by which alpha is generated relative to public markets.

IRR AND ESTIMATING PME PERFORMANCE

Investors increasingly use PME calculations to determine whether a fund manager is able to outperform the public markets. Where investors calculate public market returns using a time-weighted return calculation, they calculate private equity returns using a money-weighted return calculation (IRR). This has led to apples and oranges comparisons that are hard to evaluate. PME calculations enable investors to calculate a money-weighted return for a public market index.

Most of the PME calculations generate an IRR for a certain market index. This allows for apples to apples comparison of a fund’s IRR versus a public market index. It means, however, that PME calculations are exposed to some of the problems inherent in evaluating returns with only an IRR metric. For instance, we have previously shown that an early distribution can inflate a fund’s IRR and similarly that a fund with a lower TVPI multiple can generate the same IRR as a fund with higher TVPI multiple. There are two major points to remember about why IRR is best understood in combination with a TVPI:

IRR is a money-weighted measure – The IRR calculation is impacted by the size and timing of cash flows. This exposes the calculation to manipulation since multiple variations of cash flows can generate the same IRR. For PME IRR calculations, we believe it is important to replicate the pace of value realization in the fund when calculating an IRR for a public market index. At the same time, the PME calculation has to be sensitive to the impact of the market on the cash flows.

IRR measures speed and not size of returns – The IRR calculation assumes that realized returns can be re-invested at the same rate of return. This means that a proportionally large distribution occurring early in a fund’s life will have a disproportionate impact on the IRR for the life of the fund. When evaluating a private equity fund, it is important to look at the fund’s IRR alongside its TVPI multiple. This standard should also be followed when conducting PME analysis.

INTRODUCING BISON PME

Bison PME is a calculation that enables investors to measure public market IRR and TVPI performance. We developed the methodology after closely evaluating other PME methodologies and their shortcomings that result from how they handle the private equity fund’s cash flows. Specifically, we believe that it is important to leave constant the speed and proportionate value generated in the fund when calculating a PME IRR. We want to lower the risk of PME IRR being impacted by how IRR is calculated market. Based on early testing of 125 funds, Bison PME showed less volatility than other PME methodologies while accurately reflecting changes in public market index value.

CLICK HERE TO LEARN MORE ABOUT CALCULATING BISON PME AND READ OUR INITIAL WHITE PAPER.

We believe PME methods are important for understanding private equity performance and encourage investors to incorporate it into their fund performance analysis. The Bison PME method is an open standard provided for free. We believe it is best used side-by-side to Kaplan Schoar, but also encourage comparison with other PME methods.

Bison PME is available today for free to all Bison Performance Calculator users.