Bison

Industry intelligence that matters

Category: Investment Analysis

Will Oil’s Decline Crush Energy PE Funds

by Michael Roth
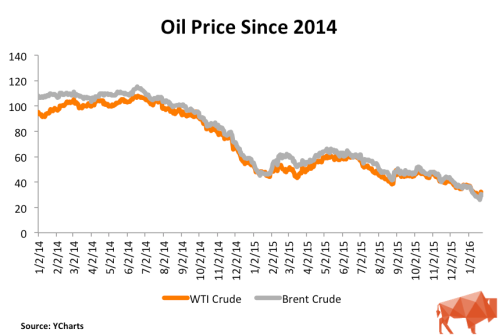
Oil Prices

The conventional wisdom is that energy fund returns and oil price movements go hand-in-hand. Since the beginning of 2014, oil prices have fallen 70% and they have tumbled 50% from where they were just since the end of Q2 2015. Does this mean that energy funds are destined for a similar decline?

Our Q3 2015 performance information is still coming in and Q4 data is a few months away. Therefore, I turned to our fund and cash flow data to determine whether or not the 50% fall in oil prices will mean energy-focused funds should expect a similar drop-off. Using regression analysis, I compared the quarterly energy fund returns to both the quarterly returns of WTI crude and the broader Energy Price Index maintained by the World Bank.

Is There A Link Between Energy Funds and Oil Prices?

WTI Crude Analysis

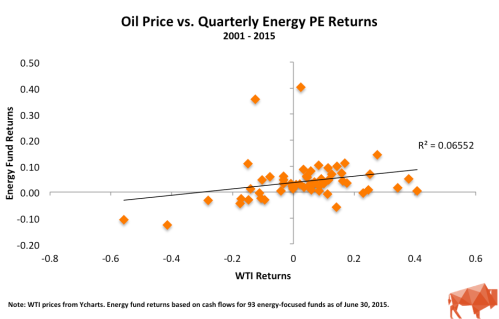
I used our Bison funds to analyze the cash flows of 93 energy-focused private equity funds with vintage years between 2001 through 2013. These funds represent a little more than $160 billion of committed capital to the sector during this time. I grouped the funds into a portfolio and ran a simple regression analysis of the quarterly time-weighted returns against the quarterly returns of WTI crude oil.
Oil Price vs Returns

The scatter plot appears to show some correlation between oil prices and energy fund returns but the relationship (R-squared) is weak. R-squared values below 0.5 are generally not considered strong and a value of 0 indicates no relationship. Part of the reason for the low R-squared are the two noticeable outliers. These are from Q4 2004 and Q2 2005 and both instances can be attributed to large valuation increases in First Reserve IX and Carlyle/Riverstone Global Energy and Power Fund II. If you excluded these quarters from the analysis, the R-squared jumps to 0.296 – a 4x increase but still well below a value that is considered meaningful.

Energy Price Index Analysis

The Energy Price Index is a weighted average of global energy prices maintained by the World Bank. Specifically, the index is weighted as follows: Oil – 84.6%, Natural Gas – 10.8%, and Coal – 4.7%. During the second half of 2015, this index experienced a decline similar to WTI oil prices, falling 37%. I used this broader measure to see whether a more comprehensive index may show a stronger correlation with energy fund returns.Energy Price Index vs Returns

Similar to the comparison against the WTI oil price, the scatter plot appears to show a correlation but the R-squared of 0.092 indicates that the relationship is not strong.

Why Is the Correlation Weak?

There are likely a number of reasons why energy fund returns may not be entirely correlated to oil prices. Major variables include:

  • Initial purchase price
  • Debt levels
  • The presence of hedging contracts
  • Diversity of business’s operations
  • Portfolio diversification over several years
  • Insufficient sample size (n = 56, which covers 14 years of quarterly data)

The first four considerations could indicate why a company could performs independent of oil prices. Portfolio diversification would be the GP’s attempt to invest in companies over several years which should mean they are investing in companies at different points in the energy price cycle.  Another possibility is that the sample size is not large enough to be meaningful. A sample size greater than 100 is generally considered meaningful.

If oil prices aren’t the answer, could the reality be that energy fund returns are related more to their buyout fund brethren than to oil? Going back to our Bison funds, I ran a simple regression analysis of quarterly energy fund returns against a portfolio of 402 North American and Global buyout funds, excluding energy funds, from 2000 – 2013.

Buyout vs. Energy Returns

As the chart above shows, the R-squared of 0.433 is much higher than 0.066 – the R-squared of oil and energy funds’ returns. This R-squared is still below the meaningfulness threshold of 0.5 but this could indicate that energy private equity fund returns have a closer relationship to buyout funds than they do to energy prices.

Wrapping Up

Make no mistake, the steep decline in energy prices will negatively impact energy fund returns in Q3 and Q4 2015. However, the analysis above highlights that the price of energy is not the only factor, and may not even be the primary factor, that contributes to the energy fund returns.

How Do GPs Calculate Net Asset Value?

by Michael Roth

For funds that are not fully exited, the net asset value (“NAV “) is the primary component of its total value. This means the NAV plays a critical role in determining a fund’s performance metrics (TVPI multiple and IRR). It is the sum of each portfolio company’s NAV and these values are determined by the GP. As a result, it is important to understand how a GP values their portfolio companies and the accounting standards that guide this process.

At the gross cash flow level, this includes the value of the GP’s equity ownership stake in each portfolio company that has not been sold. At the net cash flow level, this includes: (1) the value of the GP’s equity ownership stake in each portfolio company that has not been sold and (2) the amount of carried interest that has been accrued by the manager given the fund’s current value.

Technically speaking there is a hierarchy, broken up into three levels, that GPs must follow when they value companies. The hierarchy below has been paraphrased from the FASB’s “Fair Value Measurements and Disclosures (Topic 820)”:

Level 1 –  Investments must be valued using objective, observable, unadjusted quoted market prices for identical investments in active markets on the measurement date, if available.

Level 2

  1. Objective, observable quoted market prices for similar investments in active markets.
  2. Quoted prices for identical or similar investments in markets that are not active.
  3. Inputs other than quoted prices that are observable for the asset.
  4. Inputs that are derived principally from or corroborated by observable market data by correlation or other means.

Level 3 – Subjective unobservable inputs for the investment where markets are not active at the measurement date. Unobservable inputs reflect the firm’s own assumptions about the assumptions that market participants would use in pricing the investment and should be developed based on best information available under the circumstances. The entity’s own data shall be adjusted if information is reasonably available without undue cost and effort that indicates that market participants would use different assumptions.

In short, the majority of private equity portfolio companies are considered “Level 3” assets because they are illiquid assets that are only valued on a quarterly basis. As a result, companies can be valued by using a combination of factors that are ultimately subject to the GP’s discretion. The exception to this “rule” is when a GP exits a company via the public markets and holds publicly listed stock. Those assets will be “Level 1” assets.

A Deeper Dive into Level 3 Assets

Since there is considerable leeway with valuing Level 3 assets, I will discuss the most common methodologies used by GPs: industry comparables, precedent transactions, and the discounted cash flow (“DCF”) method.

Industry Comparables Method

The industry comparables method seeks to find publicly listed companies whose business operations either fully or partially match the business operations of the company being evaluated. Comparable companies are initially filtered by geography and sector. From there, GPs will look to narrow down the peer set further using either revenue, EBITDA or enterprise value (“EV”) metrics. For example, if I am valuing a company with an EV of $300 million, it is more appropriate to compare it to companies of a similar size rather than a company that has an EV of $4 billion.

Once GPs have a comp set, they will find the average EV/EBITDA multiple and use that multiple as the basis for valuing their company. Depending on company metrics, GPs may make adjustments to the multiple higher or lower. Factors that could impact this include higher (or lower) historical revenue or EBITDA growth, higher (or lower) forecasted revenue or EBITDA growth,  higher (or lower) EBITDA margins, higher (or lower) debt levels, and company size relative to the comps. These are the most common factors and offer a sense of possible areas where subjectivity could come into play.

Precedent Transactions Method

Precedent transactions are recent acquisitions that have occurred of similar companies. GPs will use the valuation metrics (EV/EBITDA or EV/revenue) to value their companies. This data can be difficult to find and is often limited to transactions of public companies. The other common issue with this method is that valuation information is often stale because precedent transactions occurred several years earlier when market conditions were different. Generally speaking, precedent transactions that have occurred within in the last year are considered to be valid data points.

DCF Method

The discounted cash flow methodology uses a GP’s cash flow model to estimate the company’s value. This is the most subjective method and has a tendency to be viewed with skepticism whenever it is used. That is because you are relying on the GP’s estimates for a large number of inputs, including revenue growth, EBITDA growth, and EV/EBITDA multiples and the discount rate. A slight adjustment to any one of these factors could have a meaningful impact on a company’s valuation.

When a GP uses a DCF model to value a company, it is important to understand why they are doing this and what assumptions they are using. At Bison and from my prior fund of funds days, I have not seen a DCF model used by itself very often. Sometimes, a GP will use this alongside the industry comparables methodology. In this situation, they will assign a weighting (ex. 50/50 or 75/25) to the valuation generated by the industry comps method and the DCF method.

Wrapping Up

Knowing how a GP calculates the NAV helps inform your opinion about the validity of the fund’s performance metrics but it can also offers insights into the GP’s character – are they fair and honest; do they have a tendency to be aggressive; or maybe they are slow to adjust to a changing situation. From an LP perspective, make sure to ask the right questions – how and why are you valuing your companies in this way? From a GP’s perspective, make sure that you are consistent and transparent about your valuation process. Nothing raises red flags more than dramatically changing your methodology or shrouding your process in secrecy.

Understanding Private Equity Cash Flows

by Michael Roth

From our experience working with 100s of participants on both sides of the market, there are lingering uncertainties and varying interpretations about how best to prepare and analyze cash flows. Our goal is to help GPs and LPs build and present cash flows in a consistent manner.

In the discussion below and subsequent pieces, I will detail how we at Bison think about cash flows and what we believe should be the industry standard. Our thinking closely aligns with the CFA Institute’s Global Investment Performance Standards (“GIPS”) and their Guidance Statement of Private Equity.

Read the rest of this entry »