What are Recallable Distributions?
by Michael Roth
A recallable distribution is a distribution to LPs that GPs have the right to call again for the purpose of investing. This is a term that gets negotiated at the time of the fund’s formation. There are two primary situations where recallable distributions come into play:
- A GP will receive a distribution from a portfolio company within a short period of time (typically 12 or 18 months depending on the fund’s terms) and then use, some or all, of those proceeds to make a new investment.
- A GP will distribute capital to LPs that is the result of calling more capital than is necessary for an investment. This is commonly referred to as a return of excess capital called. [UPDATE – I received feedback from industry participants and some clarification from the CFA Institute, which leads me to believe that these should not be considered/treated like recallable distributions but rather should be treated like a reduction in capital called.]
From a fund cash flow perspective, these are the important points to remember:
- The recallable distribution should be included as a distribution in the cash flows.
- The amount that gets reinvested should be included as a contribution in the cash flows.
- The amount that gets labelled a recallable distribution gets added back to the amount of unfunded capital that has yet to be called.
From an analysis standpoint, LPs need to be able to gauge how much money a GP returned on the entire amount of capital that is called. However, there are two schools of thought regarding how to calculate performance metrics given the presence of recallable distributions.
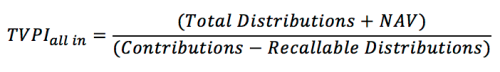
“All in method” – Calculate the TVPI multiple using the guidelines stated above where recallable distributions are classified as distributions and the amount that gets re-invested is classified as a capital contribution.
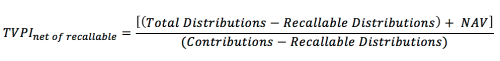
“Recallable Distribution Excluded method” – Subtract the recallable distribution amount from the capital contribution and distribution side. Calculate the TVPI multiple using these smaller net numbers. Based on our investor data, we can see there are several large consultants who prepare their data in this manner.
Bison recommends using the “all in method” as the true measure of a manager’s investment acumen. Using the “All in method” will produce lower performance multiples while the exclusion method will be more favorable to GPs. To see how each methodology impacts the DPI and TVPI multiples, I have calculated the metrics for both methods using Apollo VII as an example. Using cash flow data from investors we track, I deduced an approximation of the recallable distribution amount.
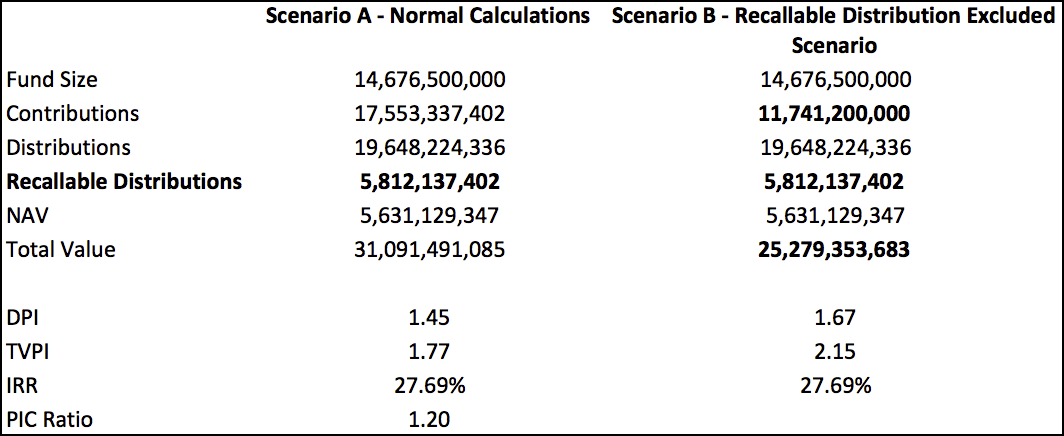
As the figure shows, the DPI and TVPI ratios are dramatically different because the recallable distribution amount of $5.8 billion is subtracted from the contributions and the distributions in Scenario B. This results in a TVPI multiple calculated as follows:
25,279,353,682 / 11,741,200,000 = 2.15
The point of scenario B is to highlight the benefit of recycling, which is really a fund management skill as opposed to an investment skill. From an LP perspective, any amount invested above and beyond their original commitment should benefit the LP. However, Scenario B’s calculations can be confusing and muddle the actual fund statistics.
Instead of using Scenario B, a more logical way to showcase the benefits of the recycling and proactive cash management would be to highlight the PIC ratio in addition to the DPI and TVPI multiples. The PIC ratio is defined as Paid In Capital / Committed Capital and it tells you how much of the fund has been invested. In the example above, Apollo VII has a PIC ratio of 1.2, meaning they have invested 20% more than LPs committed. You can illustrate recycling’s positive impact by multiplying the PIC ratio by the TVPI multiple. The equations below show how this method generates a more logical result than what occurs in Scenario B.
TVPI * PIC Ratio = Net Fund Multiple
⇒ 1.77 * 1.2 = 2.12
Total Value / Fund Size = Net Fund Multiple
⇒ 31,091,491,084 / 14,676,500,000 = 2.12
In summary, the way you treat recallable distributions can have a major impact on your performance metrics. Bison recommends using the “all in” approach as it is a fair and full representation of a manager’s performance. At the same time, we encourage managers to highlight the benefits of their proactive fund management skills by showing the fund’s ultimate returns as a result of a PIC ratio greater than 1.0.
