Bison

Industry intelligence that matters

Category: Buyout

Buyout Returns Soar While Hedge Funds Underperform

by Michael Roth

Private equity is an alternative asset class but we view it as a subset of the broader equity asset class. It shares this commonality with hedge funds which have been in the news a lot over the last few years because of their dismal returns. No story was bigger than CalPERS’ decision to exit hedge funds 18 months ago. However, the decision was not too surprising when you take a step back and look at hedge fund returns in relation to other asset classes.

The chart below uses quarterly time-weighted returns to plot the growth of one dollar invested in three different buckets of the equity asset class since 2006.

HFRI vs Buyouts

From 2006 through Q3 2015, hedge funds have dramatically underperformed the North American buyout industry as well as the public markets. The chart above shows that $1 invested in the HFRI Fund Composite Index would have resulted in just $1.40 as of Q3 2015. That’s 49% lower than what $1 invested in the buyout industry would have generated as of Q3 2015.

Lower Risk Has Not Compensated for Lower Returns

Screen Shot 2016-03-29 at 8.44.52 AM

The hedge fund industry could try to make an argument that lower returns have been in exchange for lower volatility and risk. However, the difference between the standard deviation of the HFRI’s returns and North American buyouts’ returns is less than 100 basis points. This reduction in risk is not nearly enough to compensate for a 49% lower return over the last 9.5 years.

Wrapping Up

Buyout returns have dramatically outperformed their hedge fund brethren.  It’s a more complicated calculation that simply taking from one allocation and putting it into another but, given how stark the difference in returns has been, it’s surprising that we have not heard about a larger move out of hedge funds and into buyouts.

Digging In To Distributions: An Update on Venture Capital’s Issue

by Michael Roth

Last summer, I highlighted the glaring lack of distributions within the VC industry since the late 1990s. It’s been over six months since I published that piece so I wanted to provide an update on where things stand through June 30, 2015.

VC Funds Have Cashed Out Where They Could

Q2 2015 VC DPI and TVPI

Venture capital funds saw a strong distribution pace during the first half of 2015. Looking at the DPI:TVPI ratios, the 2003 – 2007 vintage years saw a noticeable increase – improving by 32% on average. Three of those vintage years jumped above 0.5 barrier which means the average fund has distributed more than half of its total value. As a reminder, the DPI:TVPI ratio is a measure of how much of a fund has been realized (a ratio of 1 means the fund is fully realized).

DPI Multiples Improved but Still Below 1.0x

DPI multiples are still struggling to reach 1.0x, which means the average fund since 1998 has yet to return 100% of what investors have paid in.

VC DPI Since 98
The two years that stick out are 2003 and 2010. These are the vintage years that saw the biggest increase in median DPI. 2003 sticks out because it is on the cusp of a 1.0x DPI multiple but 2010 actually saw a bigger increase, percentage-wise. Funds that drove the increase in 2010 include Union Square Ventures Opportunity Fund and Insight Venture Partners VII on the tech side and Third Rock Ventures II, Orbimed Private Investments IV, and MPM Bioventures V on the healthcare side. 

VC DPIs Lagging But TVPIs Not As Far Behind

My analysis of VC distributions so far has highlighted the positive developments. What can’t be ignored is that these positive developments have not occurred in a vacuum. The buyout industry’s DPI multiples also improved and are still higher than the venture capital industry for 13 of the 15 vintage years from 1998 through 2012.

Buyout vs. Venture

While the DPI multiples have clearly been lagging, venture capital’s median TVPI multiples have shown strength over recent vintage years. The big question is whether these TVPI multiples are real or is it a matter of time before they come back to reality. 

Final Thoughts

Venture Capital had a solid two quarters to start off 2015 but the DPI issue still remains. Since the industry is prone to large valuation fluctuations, the ability to cash out when times are good is an important part of being successful. This analysis is also important because investors need to analyze and decide whether an allocation to venture capital is worth the risk.

While DPI multiples have increased across nearly every vintage year, the DPI:TVPI ratio is still lower than that of the buyout industry for all but one vintage year since 2000. This means LPs remain highly exposed if this current cooling off phase accelerates into a bigger decline.

Will Oil’s Decline Crush Energy PE Funds

by Michael Roth

Oil Prices

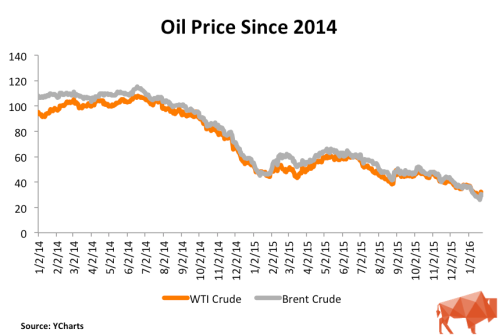
The conventional wisdom is that energy fund returns and oil price movements go hand-in-hand. Since the beginning of 2014, oil prices have fallen 70% and they have tumbled 50% from where they were just since the end of Q2 2015. Does this mean that energy funds are destined for a similar decline?

Our Q3 2015 performance information is still coming in and Q4 data is a few months away. Therefore, I turned to our fund and cash flow data to determine whether or not the 50% fall in oil prices will mean energy-focused funds should expect a similar drop-off. Using regression analysis, I compared the quarterly energy fund returns to both the quarterly returns of WTI crude and the broader Energy Price Index maintained by the World Bank.

Is There A Link Between Energy Funds and Oil Prices?

WTI Crude Analysis

I used our Bison funds to analyze the cash flows of 93 energy-focused private equity funds with vintage years between 2001 through 2013. These funds represent a little more than $160 billion of committed capital to the sector during this time. I grouped the funds into a portfolio and ran a simple regression analysis of the quarterly time-weighted returns against the quarterly returns of WTI crude oil.

Oil Price vs Returns

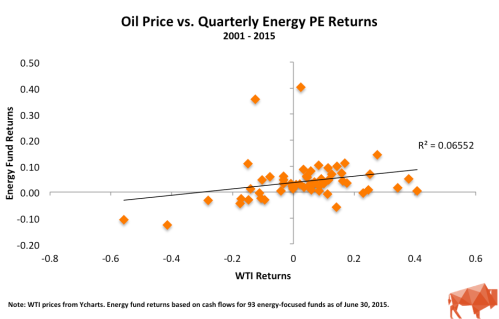
The scatter plot appears to show some correlation between oil prices and energy fund returns but the relationship (R-squared) is weak. R-squared values below 0.5 are generally not considered strong and a value of 0 indicates no relationship. Part of the reason for the low R-squared are the two noticeable outliers. These are from Q4 2004 and Q2 2005 and both instances can be attributed to large valuation increases in First Reserve IX and Carlyle/Riverstone Global Energy and Power Fund II. If you excluded these quarters from the analysis, the R-squared jumps to 0.296 – a 4x increase but still well below a value that is considered meaningful.

Energy Price Index Analysis

The Energy Price Index is a weighted average of global energy prices maintained by the World Bank. Specifically, the index is weighted as follows: Oil – 84.6%, Natural Gas – 10.8%, and Coal – 4.7%. During the second half of 2015, this index experienced a decline similar to WTI oil prices, falling 37%. I used this broader measure to see whether a more comprehensive index may show a stronger correlation with energy fund returns.Energy Price Index vs Returns

Similar to the comparison against the WTI oil price, the scatter plot appears to show a correlation but the R-squared of 0.092 indicates that the relationship is not strong.

Why Is the Correlation Weak?

There are likely a number of reasons why energy fund returns may not be entirely correlated to oil prices. Major variables include:

  • Initial purchase price
  • Debt levels
  • The presence of hedging contracts
  • Diversity of business’s operations
  • Portfolio diversification over several years
  • Insufficient sample size (n = 56, which covers 14 years of quarterly data)

The first four considerations could indicate why a company could performs independent of oil prices. Portfolio diversification would be the GP’s attempt to invest in companies over several years which should mean they are investing in companies at different points in the energy price cycle.  Another possibility is that the sample size is not large enough to be meaningful. A sample size greater than 100 is generally considered meaningful.

If oil prices aren’t the answer, could the reality be that energy fund returns are related more to their buyout fund brethren than to oil? Going back to our Bison funds, I ran a simple regression analysis of quarterly energy fund returns against a portfolio of 402 North American and Global buyout funds, excluding energy funds, from 2000 – 2013.

Buyout vs. Energy Returns

As the chart above shows, the R-squared of 0.433 is much higher than 0.066 – the R-squared of oil and energy funds’ returns. This R-squared is still below the meaningfulness threshold of 0.5 but this could indicate that energy private equity fund returns have a closer relationship to buyout funds than they do to energy prices.

Wrapping Up

Make no mistake, the steep decline in energy prices will negatively impact energy fund returns in Q3 and Q4 2015. However, the analysis above highlights that the price of energy is not the only factor, and may not even be the primary factor, that contributes to the energy fund returns.

Venture Capital Continues its Hot Streak

by Michael Roth

Bison’s June 30, 2015 final benchmarks were published last week. Using our cash flow dataset (“Bison funds”), we are able to analyze close to 1,300 North American private equity funds and identify industry trends.

Horizon IRR

The chart below illustrates the 1, 3, 5, and 10-year horizon IRRs for North American All PE, Buyouts, and Venture Capital / Growth Equity.

Q2 2015 Horizon IRRs

For the second consecutive quarter, the venture capital industry has a higher IRR over the 1, 3, and 5-year periods than the buyout industry. VC is still lagging buyouts on the 10-year horizon but it has narrowed the gap by 100 basis points over the last two quarters.

Time-Weighted Returns

The chart below looks at the returns for private equity and the public markets using an apples-to-apples time-weighted methodology.

Q2 2015 TWRR

Over the short-term and long-term, private equity is outperforming the public markets, represented here by the Russell 2000 and Russell 3000 total return indices. Similar to the horizon IRRs, venture capital is outperforming buyouts over the 1, 3, and 5-year periods. Over the 10-year period, buyouts are still outperforming venture capital by more than 200 basis points. Looking at the medium-term (3 and 5-year horizons), the public markets are outperforming through June 30, 2015. It will be interesting to see how these numbers hold up as of Q3 and Q4 2015.

Investment Activity

Investors are surely happy with the strong returns but they must also be pleased that GPs were busy selling assets and locking in gains. The chart below illustrates the ratio of distributions to contributions during each of the last four quarters. A ratio greater than 1.0 means there were more distributions than contributions in the quarter.

Dist vs. Calls

Both the venture capital and buyout industries saw their Distributions/ Contributions ratios jump in Q2 2015. Given how tumultuous the public markets were during the second half of 2015, it will be interesting to see how this ratio changes in Q3 and Q4. The surge in distributions is also notable for the VC industry because the inability to return money to investors has been an issue that I have highlighted before.


Understanding Private Equity Cash Flows

by Michael Roth

From our experience working with 100s of participants on both sides of the market, there are lingering uncertainties and varying interpretations about how best to prepare and analyze cash flows. Our goal is to help GPs and LPs build and present cash flows in a consistent manner.

In the discussion below and subsequent pieces, I will detail how we at Bison think about cash flows and what we believe should be the industry standard. Our thinking closely aligns with the CFA Institute’s Global Investment Performance Standards (“GIPS”) and their Guidance Statement of Private Equity.

Read the rest of this entry »

The Horizon IRR Metric Keeps Being Misused

by Michael Roth

Accurately measuring performance and estimating asset class returns is the most important part of the asset allocation process. The reason it is important is two-fold: (1) return estimates have the biggest impact on your asset allocation model and (2) studies have shown that asset allocation is a critical component of returns.

Considering this, industry trade groups, like the BVCA, and service providers, like Cambridge Associates, continue to inappropriately tout a horizon IRR calculation in comparison to the public market’s 1,3, 5, or 10 year time weighted rate of return.

As I have discussed previously, it is a mistake to think an IRR and a time weighted return are one and the same. Both are annualized rates of return but they deal with cash inflows and outflows in different ways. IRR specifically accounts for the timing and size of cash flows when calculating the returns generated while the time weighted return specifically excludes the impact of cash flows and weights the returns in each time period equally. Each method has their shortcomings and ideal use cases. Take these metrics out of context and they can be misleading.

What difference does a return calculation make?

I used a portfolio of 481 North America and Global buyout funds from Bison’s cash flow dataset to analyze the difference between the horizon IRR and the time weighted return. Both return calculations were performed using quarterly cash flows. Read the rest of this entry »